GraphViz is a very useful tool for defining and visualizing graph structures – once you know how.
I find it’s documentation on how to use the thing a little lacking, so I’ve posted some instructions on how to get started.
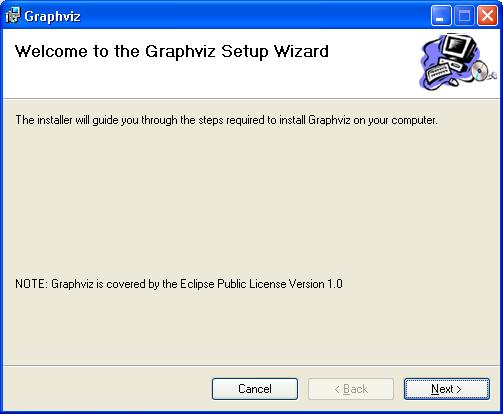
For Windows operating systems, download and install the GraphViz programmer from here:
https://www.graphviz.org/download/
I simply did a plain vanilla installation – keep pressing Next until the installation is complete.
Here is the important bit for Windows users – restart your PC after installation. When running the program straight after installation I found that it would not work properly even for the simplest of examples, but that it did so on restart. Doing this may save you from time spent messing around. In fact, if you get any problems in generating output graphs with GraphViz it, restarting the program will often rectify it.
Once restarted, run the gvedit.exe executable:
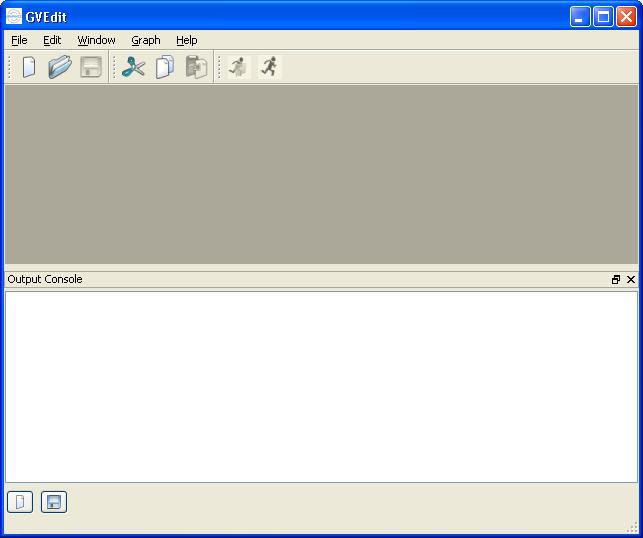
The next stage is to create a new graph. To create a new graph, select File > New and enter the graph details in the text window that appears:
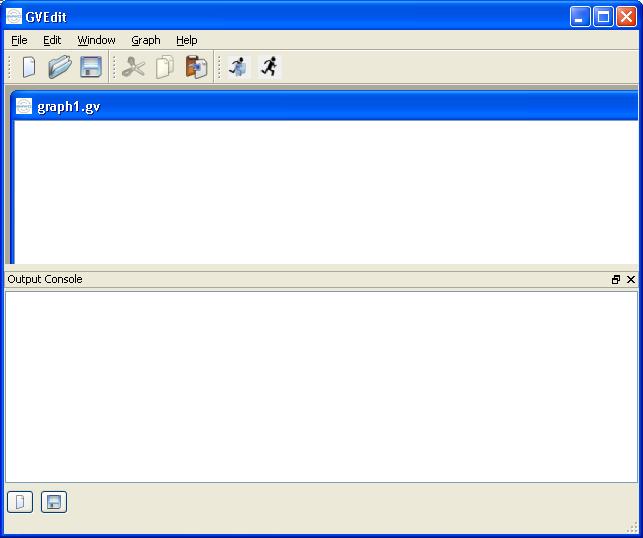
Then enter the graph details that will be saved in the form of a “dot” file. The British science fiction writer Tony Ballantyne has a particularly comprehensive set of examples over at his website:
http://www.tonyballantyne.com/graphs.html
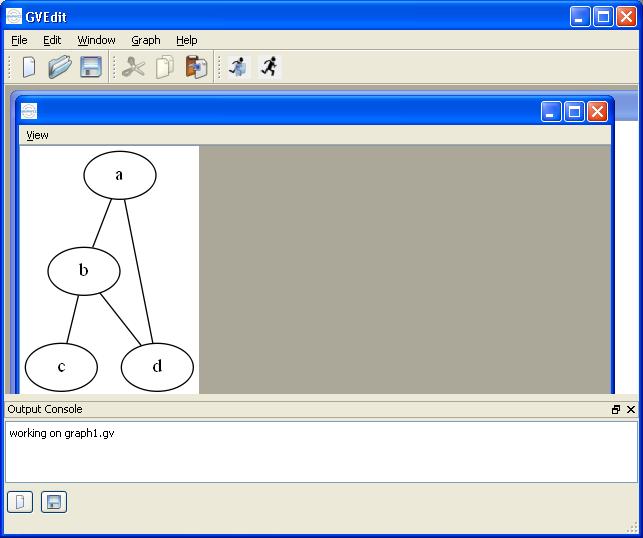
We will use the simple graph example:
graph graphname {
                a -- b;
                b -- c;
                b -- d;
                d -- a;
        }
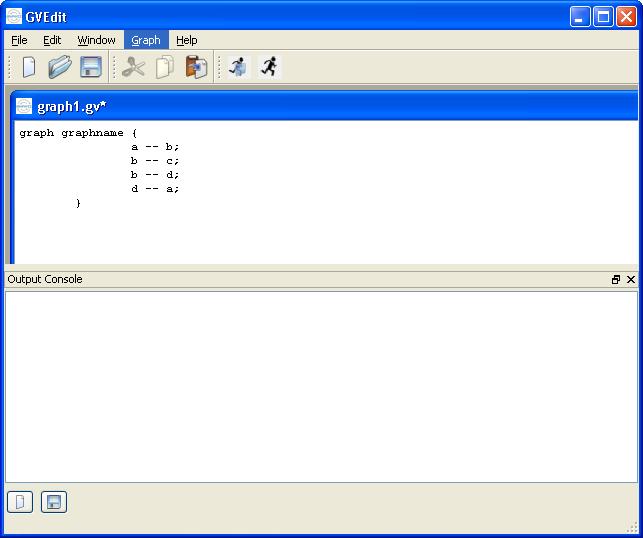
Then click the “Layout” button in the menu to generate the resulting graph: